When we look at the stock market, it’s usually through the lens of an index. The S&P 500 Index is a well-recognized barometer of the U.S. market representing the largest ~500 stocks based on their market capitalization.
The S&P 500 Index has become more concentrated in recent years. Currently the top ten companies represent 40% of the index, whereas the top ten companies comprised about half of that (18-20%) in 2015.
Increased concentration is also evident in the dominance of the information technology and communication services sectors. Eight of the top ten companies fall into those two economic sectors and these sectors comprise about 45% of the market capitalization of the S&P 500 Index.
When we wrote about concentration back in October 2025, the dynamics around these companies and sectors caused us to wonder if it would be possible to experience a recession without a stock market correction. Since then, under the influence of these segments, markets have registered new highs even as economic challenges compound.
This is evident in the robust performance of the growth indexes – sub-indexes that favor stocks anticipated to grow faster than the market – relative to value indexes – composed of companies that appear to trade at a discount to their intrinsic value. Growth indexes are even more skewed to information technology and communications services – approximately 70% of the market capitalization of the S&P 500 Growth Index is concentrated in these sectors. Over the last three years, the growth version of the S&P 500 Index has outpaced the value version by about 12% a year, largely on the promise of Artificial Intelligence (AI).
Thus far in June, however, the growth indexes have lagged. Three charts published by Apollo’s Thorsten Slok in his Daily Spark provide context for the recent weakness in growth-oriented stocks.
Sources: Bloomberg, Macrobond, Apollo Chief Economist
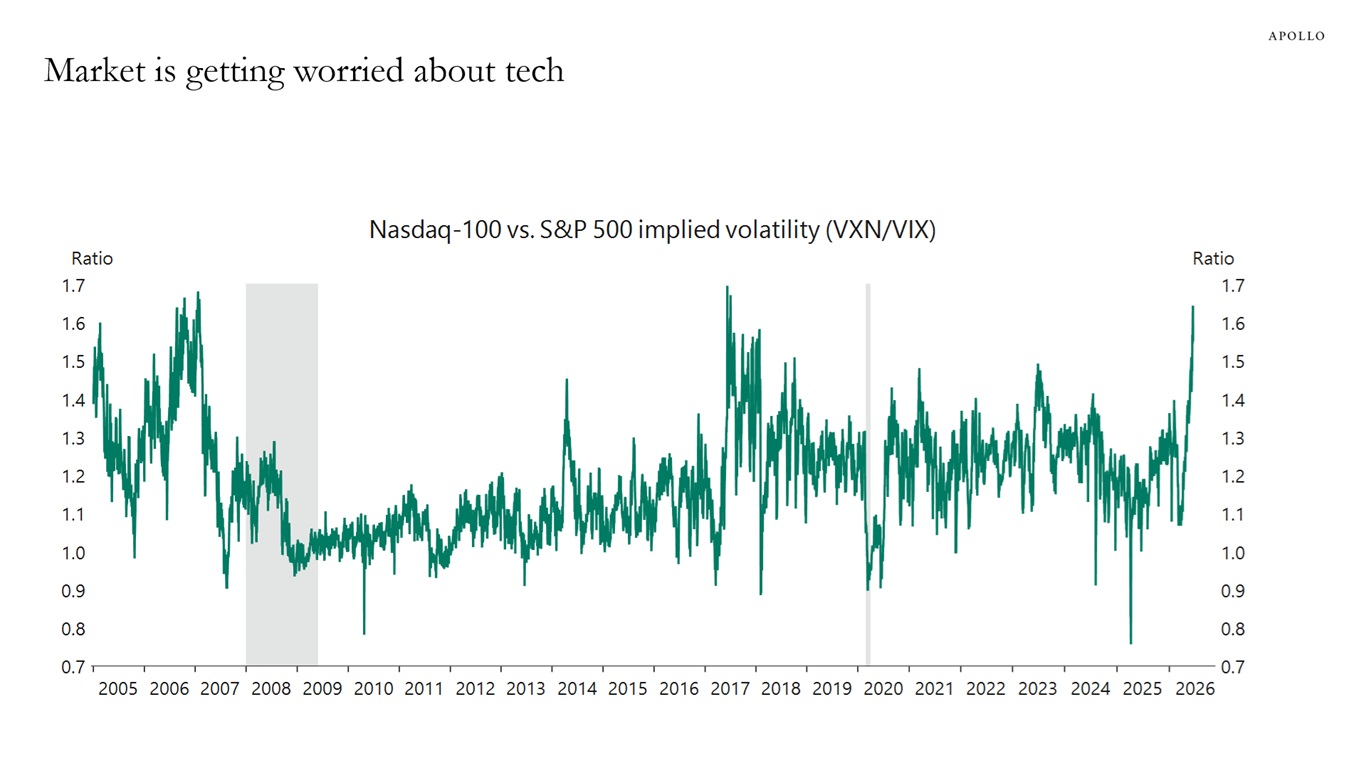
This first chart highlights a spike in the implied volatility of the technology-heavy NASDAQ Index relative to the S&P 500 Index. This chart shows that investors estimate the NASDAQ Index to be 170% more volatile than the S&P 500 Index.
Sources: Bloomberg, Apollo Chief Economist
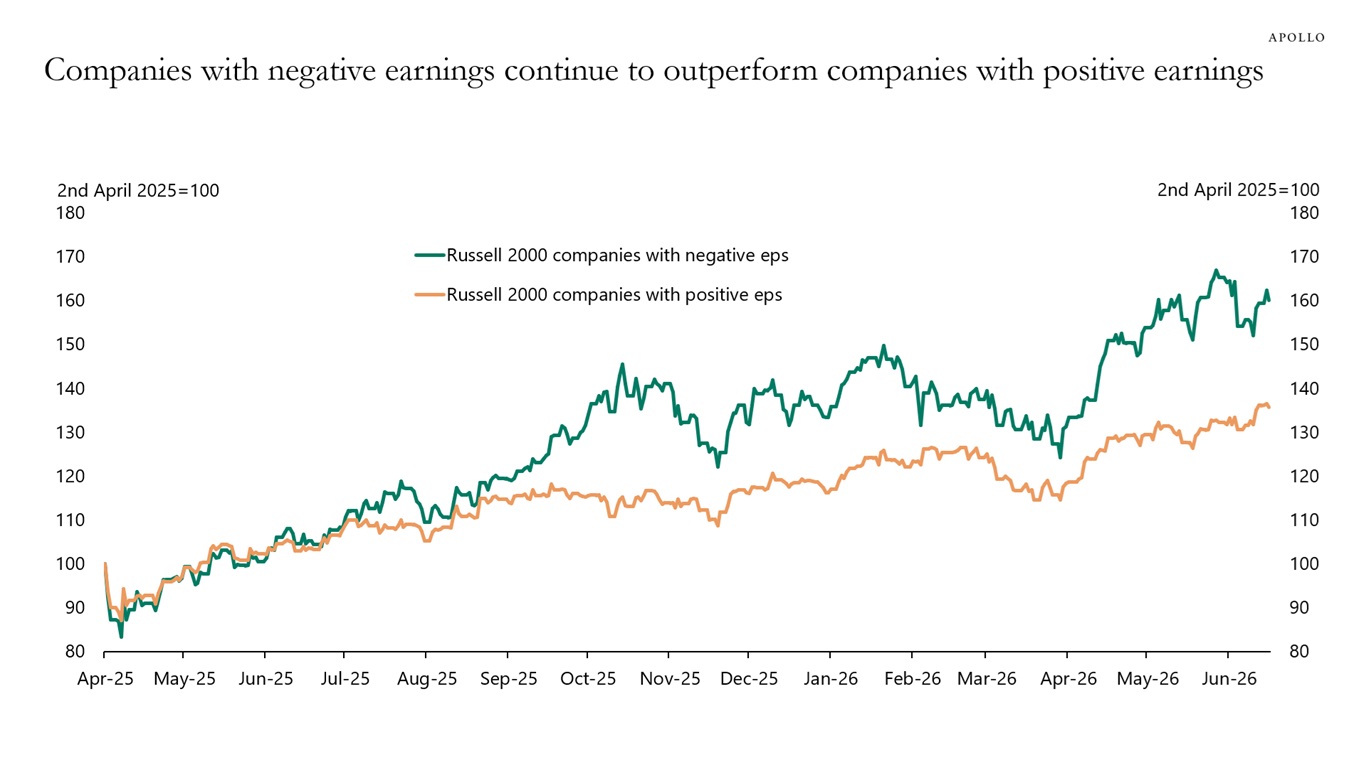
This second chart focuses on the small cap Russell 2000 Indexes where since late 2025 companies without earnings have commanded a premium over companies with positive earnings. Non-earners tend to be growth stocks as investors trade the certainty of cashflows for the promise of future gains. (Non-earner, SpaceX has seen its valuation retrench post IPO alongside other growth stocks.)
Sources: Bloomberg, Apollo Chief Economist
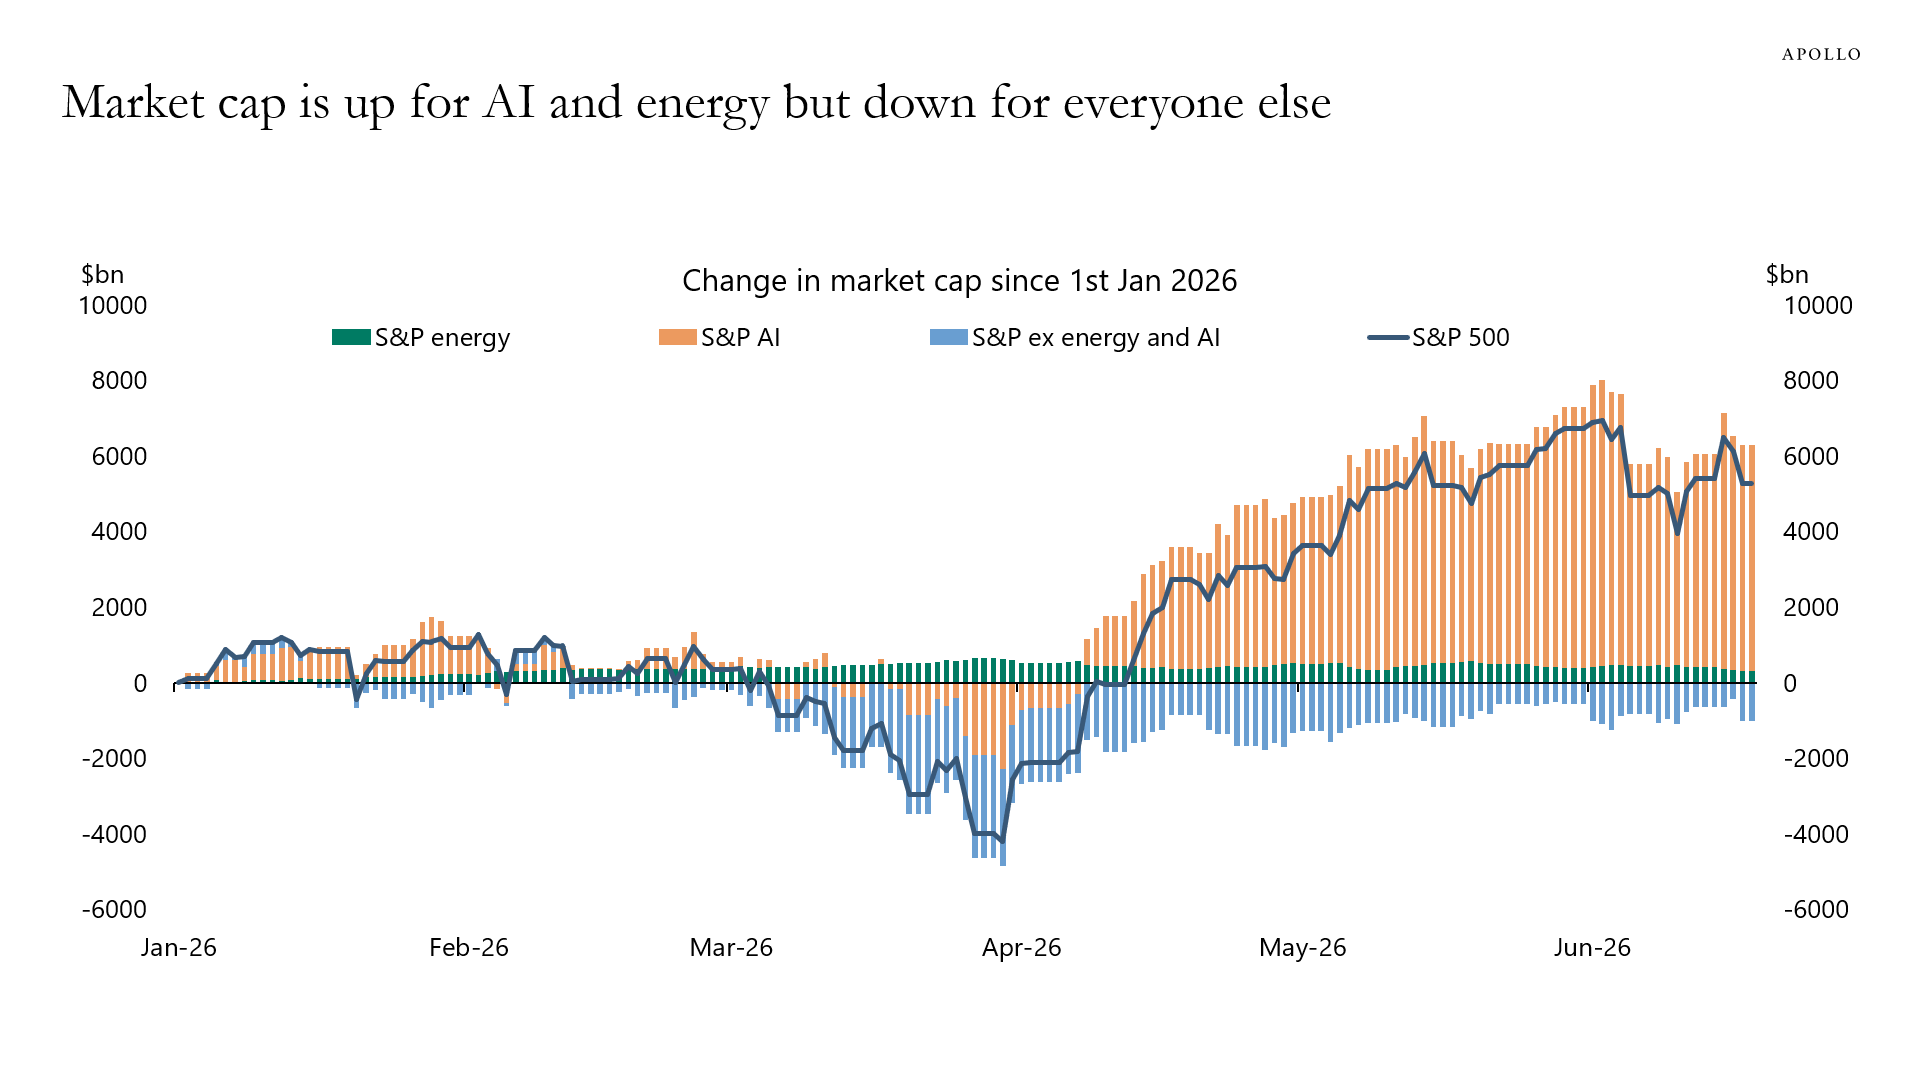
This final chart shows that excluding AI and energy, the S&P 500 Index has declined year to date. Including these segments, the S&P 500 Index was up over 10% for the year.
Viewed in aggregate, these charts indicate recent market performance has been highly concentrated in growth, technology and energy, and non-earners, and the implied volatility shows that investors are nervous about it.
Back to SoundingsTide Cycle Resources (Tide Cycle) is an investment advisor registered with the U.S. Securities and Exchange Commission. Registration does not imply a certain level of skill or training. A copy of Tide Cycle’s Forms ADV Part 2 and Form CRS are available without charge upon request. The opinions expressed are those of Tide Cycle. The opinions referenced are as of the date of publication and are subject to change due to changes in the market or economic conditions and may not necessarily come to pass. Forward-looking statements cannot be guaranteed. Nothing contained in this document may be relied upon as a guarantee, promise, assurance, or representation as to the future. This should not be taken as specific investment advice. We recommend consulting an investment/tax professional before making financial decisions based on any information provided.
Not all posts are archived here. Please reach out if there are other topics that interest you.